Flow Accumulation
Each cell in a DEM can be modeled as generating a certain amount of flow. This flow is apportioned to downstream cells according to a chosen flow metric. The flow accumulation matrix, then, is one in which every cell’s value is the summation of the flow it generates and all the flow which ultimately passes through it from upstream.
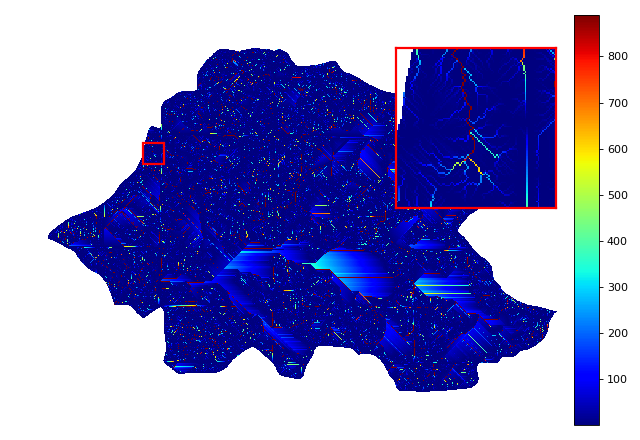
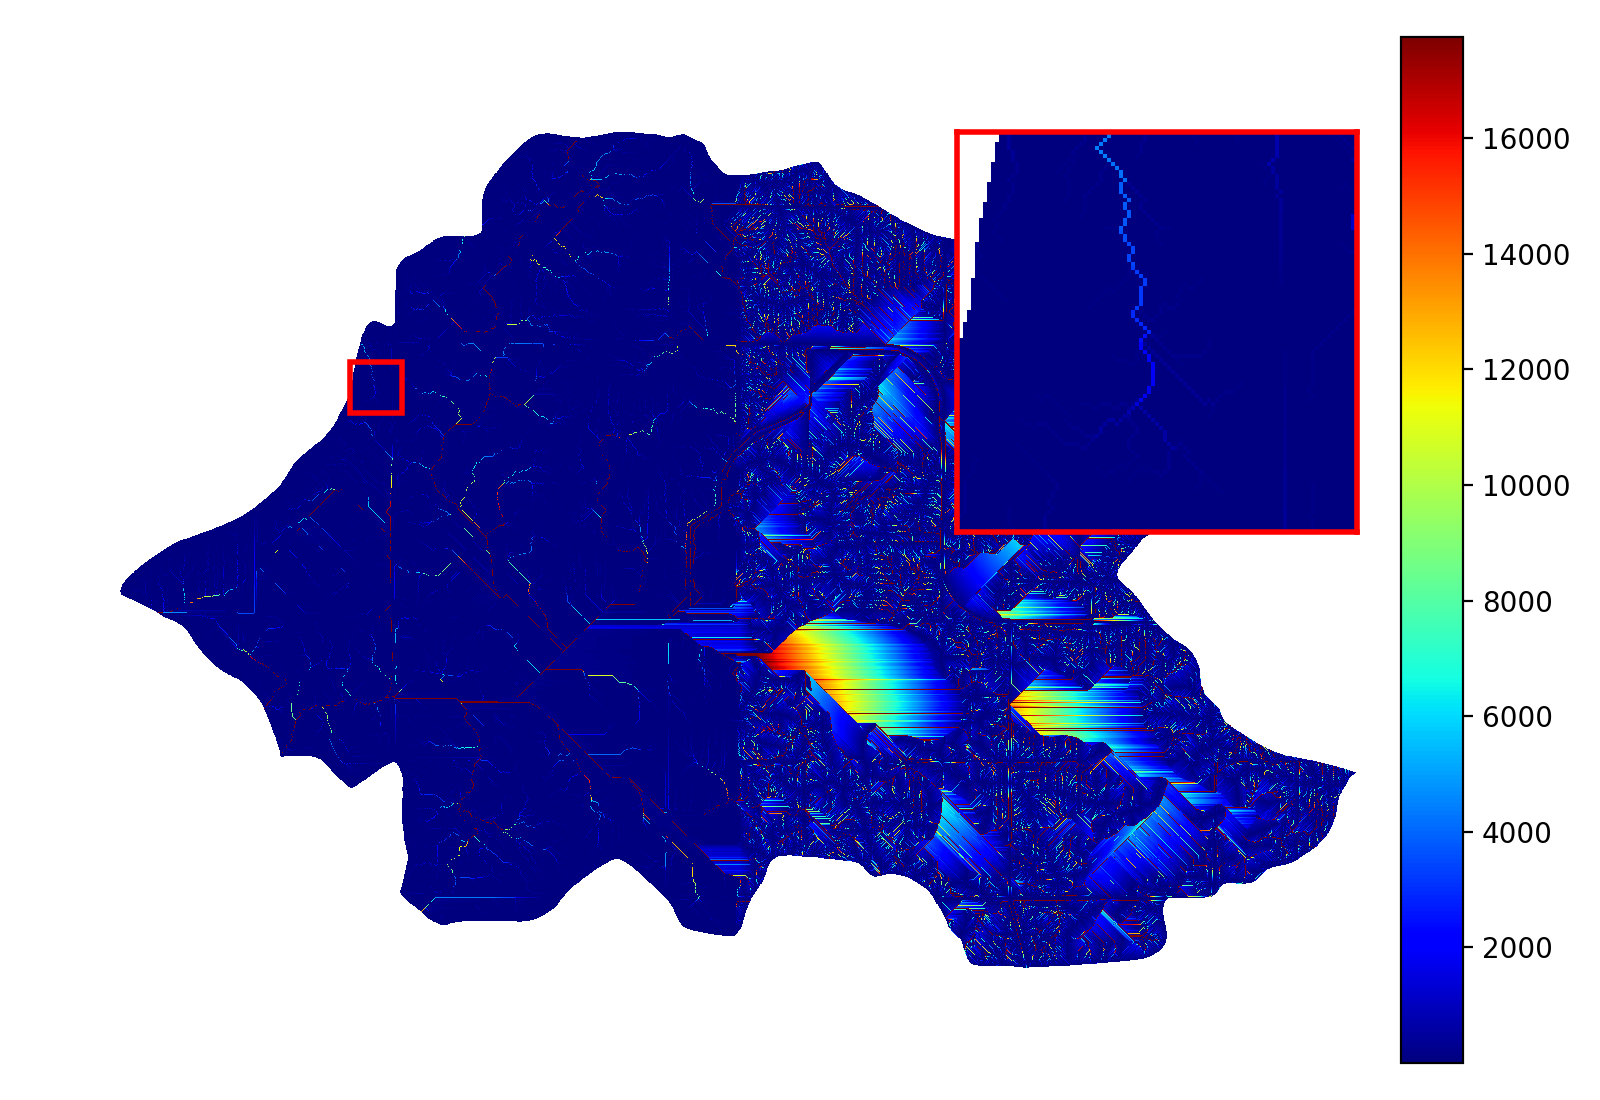
Flow Metrics shows the results of running a variety of flow metrics where each cell is modeled as producing 1 flow unit. This is shown again below for the D8 metric:
import richdem as rd
import numpy as np

dem = rd.rdarray(np.load('imgs/beauford.npz')['beauford'], no_data=-9999)

#Fill depressions with epsilon gradient to ensure drainage
rd.FillDepressions(dem, epsilon=True, in_place=True)

#Get flow accumulation with no explicit weighting. The default will be 1.
accum_d8 = rd.FlowAccumulation(dem, method='D8')
d8_fig = rd.rdShow(accum_d8, zxmin=450, zxmax=550, zymin=550, zymax=450, figsize=(8,5.5), axes=False, cmap='jet')
(Source code, png, hires.png, pdf)
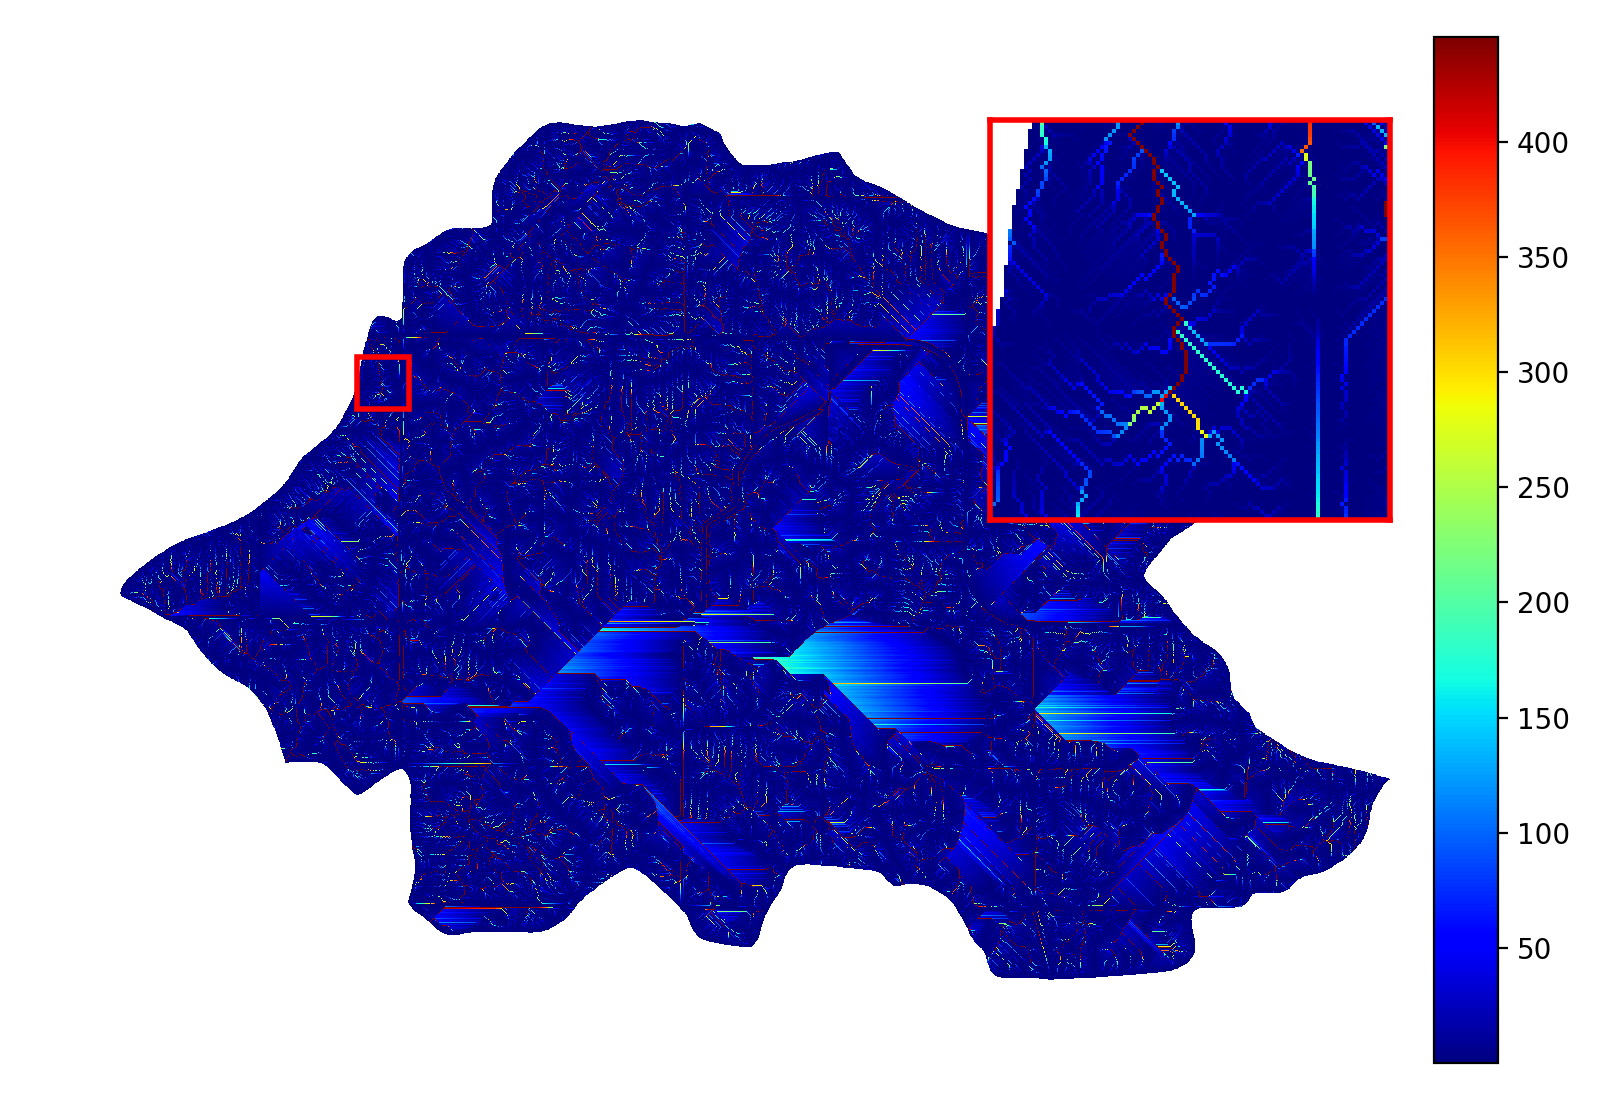
But the amount of flow produced per cell can also be varied. For example, the amount of flow generated could be uniform random:
#Generate a random flow field
accum  = np.random.random(size=dem.shape)

#Modify the flow field into a flow accumulation field in place. A view of
#the modified data is returned as a metadata-enriched rdarray.
accum  = rd.FlowAccumulation(dem, method='D8', weights=accum, in_place=True)

d8_fig = rd.rdShow(accum, zxmin=450, zxmax=550, zymin=550, zymax=450, figsize=(8,5.5), axes=False, cmap='jet')
(Source code, png, hires.png, pdf)

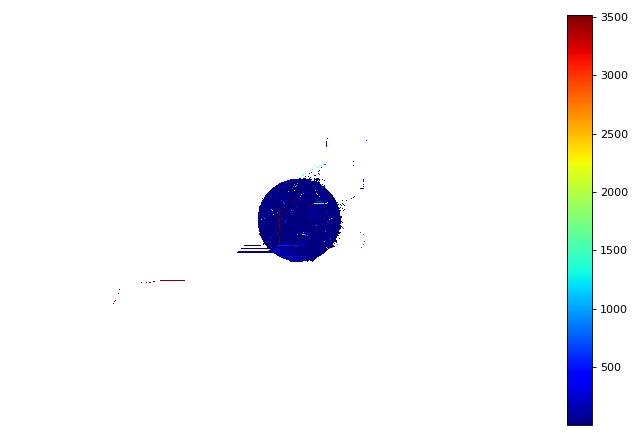
Or flow generation could be concentrated to an area, as if there were a localized rain event:
#Make a circular region of flow generation

#Create coordinate grids
yy, xx = np.mgrid[:dem.shape[0], :dem.shape[1]]
#Find squared distance from center of grid
circle = (xx - dem.shape[1]/2) ** 2 + (yy - dem.shape[0]/2) ** 2
#Take only those cells within a radius
circle = (circle < 200**2).astype('float64')

#Don't modify the original accumulation data. Return a new matrix with flow
#accumulation values.
accum  = rd.FlowAccumulation(dem, method='D8', weights=circle, in_place=False)

d8_fig = rd.rdShow(accum, ignore_colours=[0], figsize=(8,5.5), axes=False, cmap='jet')
(Source code, png, hires.png, pdf)

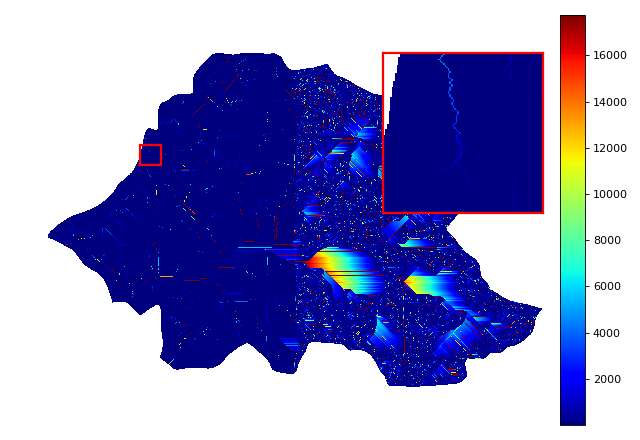
Or flow generation could be concentrated to part of a region, as though a mountain range were affecting weather:
#Create coordinate grids
yy, xx = np.mgrid[:dem.shape[0], :dem.shape[1]]

#Create nominal weights
accum = rd.rdarray(np.ones(shape=dem.shape).astype('float64'), no_data=-1)

#Increase weights on right-hand side of field
accum[xx>dem.shape[1]/2] *= 50

#Don't modify the original accumulation data. Return a new matrix with flow
#accumulation values.
rd.FlowAccumulation(dem, method='D8', weights=accum, in_place=True)

d8_fig = rd.rdShow(accum, zxmin=450, zxmax=550, zymin=550, zymax=450, figsize=(8,5.5), axes=False, cmap='jet')
(Source code, png, hires.png, pdf)

From Flow Proportions
Flow accumulation can also be generated from raw flow proportions:
props = rd.FlowProportions(dem, method='Freeman', exponent=1.1)

#30% of the flow moving along any route is absorbed
props[props>0] *= 0.7
accum = rd.FlowAccumFromProps(props=props)

rd.rdShow(accum, ignore_colours=[0], figsize=(8,5.5), axes=False, cmap='jet', zxmin=450, zxmax=550, zymin=550, zymax=450)
(Source code, png, hires.png, pdf)
